

EJSCREEN: EPA Environmental Justice Screening and Mapping Tool
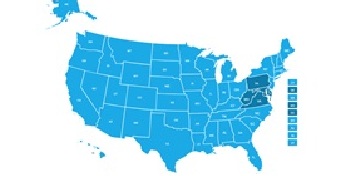
The U.S. Environmental Protection Agency (EPA) has developed a new environmental justice (EJ) mapping and screening tool called EJSCREEN. EJSCREEN allows users to access high-resolution environmental and demographic information for locations in the United States, and compare their selected locations to the rest of the state, EPA region, or the nation.
EJSCREEN users choose a geographic area, and the tool then provides demographic and environmental information for that area. All of the EJSCREEN indicators are publicly-available data.
This tool uses provides a number of capabilities including:
• Color coded mapping
• The ability to generate a standard report for a selected area
• Comparisons showing how a selected area compares to the state, EPA region or the nation
One key output from EJSCREEN is a standard printed report that describes a selected location. Sometimes the report might focus on a single Census "block group." A block group is an area defined by the Census Bureau that usually has in the range of 600-3,000 people living in it.
More typically, though, an EJSCREEN report will cover a "buffer" area, an area on the map that includes everyone who lives within a certain distance of a point, line or polygon. A point might be a factory seeking an emissions permit, for example, and the report could focus on the demographics and environmental conditions within approximately 1 mile of that factory.
In EJSCREEN, buffers can be drawn up to 10 miles around a point, line or polygon. For each indicator, the result is a population-weighted average, which equals the block group indicator values averaged over all residents who are estimated to be inside the buffer.
Each EJ index combines demographic indicators with a single environmental indicator. EJSCREEN provides 12 environmental indicators:
- National-Scale Air Toxics Assessment (NATA) air toxics cancer risk
- NATA neurological hazard index
- NATA respiratory hazard index
- NATA diesel PM
- Particulate matter
- Ozone
- Traffic proximity and volume
- Lead paint indicator
- Proximity to Risk Management Plan (RMP) sites
- Proximity to Treatment Storage and Disposal Facilities
- Proximity to National Priorities List (NPL) sites
- Proximity to major direct water dischargers
There are six demographic indicators for analysis:
- Percent Low-Income
- Percent Minority
- Less than high school education
- Linguistic isolation
- Individuals under age 5
- Individuals over age 64
If you have any trouble accessing the website link above, please find here an archived page. You may find this has limited use. https://web.archive.org/web/20161229100404/https://www.epa.gov/ejscreen
Publication Date: June 10, 2015
Related Organizations:
Related Toolkits:
Sectors:
Resource Category:
Resource Types:
- Mapping tool
- Tool (general)
