

Climate Mapping for a Resilient Washington Tool
The “Climate Impacts for a Resilient Washington” tool was developed by the Climate Impacts Group (in partnership with the University of Idaho’s Research Data & Computer Services for web development) to provide easily accessible climate information for decisionmakers working on resilience in Washington state. The tool is primarily intended for local governments, state agencies, and other officials who are considering resilience plan changes and submitting grant applications; and GIS professionals, planners, engineers, outreach specialists, and other technical staff members.
The mapping tool combines and tailors existing data to provide projections for a range of climate indicators across different sectors and hazards, at various time periods, and county-level geographies.
The tool utilizes maps, graphs, and tables across different time periods to provide possible climate condition scenarios. The tool can be used by local and state officials to prioritize resilience strategies and to inform risk reduction plans. Although the datasets used in the tool include many downscaled climate projections, the tool is best suited for community or county-scale analysis and use.
The map can be filtered by hazard and further narrowed by indicator(s) associated with each hazard, including:
- Extreme precipitation (magnitude of precipitation; 1, 2, or 3-inch precipitation days)
- Extreme heat (e.g., summer maximum temperature; stream temperature; heating and cooling days; and other indicators)
- Drought (e.g., total annual and late summer precipitation; snowpack indicators; and various indicators for streamflow timing, duration, and seasonality)
- Flooding (peak streamflow indicators)
- Reduced snowpack (snowpack and streamflow timing)
- Sea-level rise (likely and high sea-level rise estimates)
- Wildfire (wildfire danger and wildfire likelihood)
Sorting by sector (e.g., agriculture, ecosystems, transportation, water resources, and more) will automatically filter options to show the climate hazards and indicators relevant to that sector. The data can also be filtered by greenhouse gas emissions scenario (low, moderate, and high) and time period (2010 to 2039 or 2040 to 2069).
The tool also provides the user with a brief analysis surrounding the importance of the topic on a local level (considering a community’s exposure, impacts, and exposure to a climate impact). This tool attempts to account for the variability of climate impacts in terms of exposure to an impact (as flood zones, vulnerable populations, and wildland-urban interface varies across the state) and the community’s sensitivity to an impact (as different populations will experience an impact differently, which particularly is true for frontline and marginalized communities).
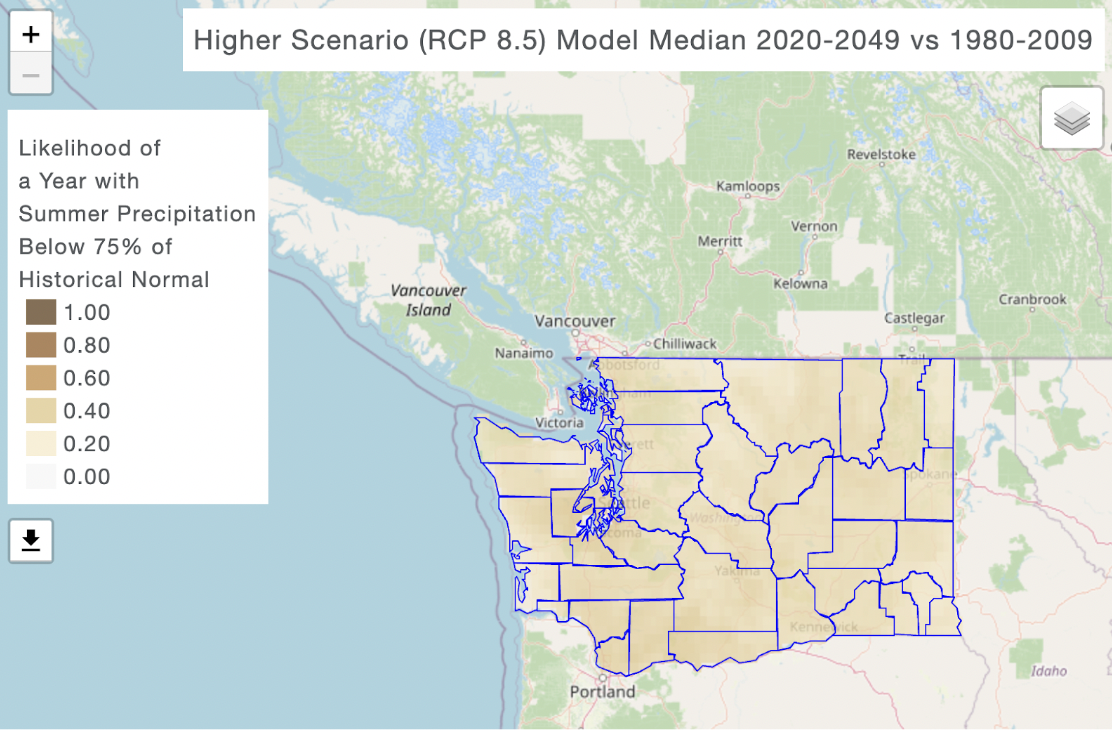
The “Climate Mapping for a Resilient Washington Tool” was developed by the University of Washington Climate Impacts Group. This interdisciplinary research team assists the Pacific Northwest decisionmakers in their interpretation of the climate risks within their area. The UW Climate Impacts Group builds knowledge on climate resilience by assessing climate risks and developing science-based action. To manage climate risks, the group develops research-based tools, provides accessible resources, and familiarizes regional decisionmakers with science. The group partners with non-profit organizations, government agencies, and community groups to develop these tools. Funding for the group stems from project-based grants, government contracts, the state of Washington, and private philanthropy.
The Climate Impacts Group developed the tool to inform the “Biophysical Climate Risks and Economic Impacts for Washington State” project. This project, led by the UW Climate Impacts Group and funded by the Washington State Legislature, aims to support a state-wide resilience strategy through assessments and updates on climate risks in Washington State.
Publication Date: December 2022
Related Organizations:
- University of Washington Climate Impacts Group
Sectors:
- Emergency preparedness
- Land management and conservation
Resource Category:
Resource Types:
- Mapping tool
States Affected:
Impacts:
- Air temperature
- Drought
- Flooding
- Permafrost melt
- Precipitation changes
- Sea-level rise
- Wildfires
