

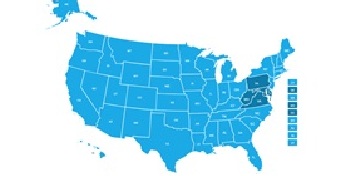
The Climate Explorer
Built to accompany the U.S. Climate Resilience Toolkit, the Climate Explorer offers graphs and maps of observed and projected temperature, precipitation, and related climate variables for every county in the contiguous United States. Additionally, the tool now offers hindcasts and projections for Alaskan boroughs. The Climate Explorer is designed to help local planners, residents, communities, businesses and others visualize the changing risks in their own communities in the coming decades by providing downscaled climate data and providing easy access to observed and projected temperature and precipitation data dating back to 1950 and out to 2100.
Users can explore the tool searching by location by entering in a county, city, or zip code into a search box; or by the following variables:
- Mean Daily Max Temperature– the warmest temperature on a given day that is an indicator for how much heat stress people, plants, animals, and infrastructure will sustain.
- Mean Daily Min Temperature – the lowest temperature on a given day that is an indicator for how easily people, plants, and animals can recover from warmer temperatures.
- Days With Max Above 95°F – to assess how often hot days will occur.
- Days With Min Below 32°F – to assess how often cold days will occur.
- Mean Daily Precipitation – one indicator for how wet or dry a place may be at different times of the year.
- Days of Precipitation Above 1 Inch – Can be used to indicate trends for increasing or decreasing flood risk.
- Heating Degree Days – A metric used by utility companies to estimate the annual amount of energy people will use to heat buildings.
- Cooling Degree Days – A metric used by utility companies to estimate the annual amount of energy people will use to cool buildings.
If you have any trouble accessing the website link above, please find here an archived page. You may find this has limited use.
http://web.archive.org/web/20170207230714/https://toolkit.climate.gov/climate-explorer2/
Publication Date: July 27, 2016
Related Organizations:
Related Resources:
Sectors:
Resource Category:
Resource Types:
- Mapping tool
Impacts:
- Air temperature
- Flooding
- Heat waves
- Precipitation changes
